You are here: Running the Model > Run-Time Menus & Controls > Dynamic Plots > Basic Operation
Please note
The Dynamic Plot dialog is only accessible during simulation run-time. If you will be creating saved chart views, you may wish to pause the simulation, define Chart views, then resume the simulation.
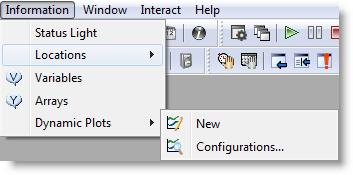
Dynamic plots are set up using the Information | Dynamic Plots menu during simulation. Under Dynamic Plots you will find two sub-items, New and Configurations…
New opens a window similar to the one below.
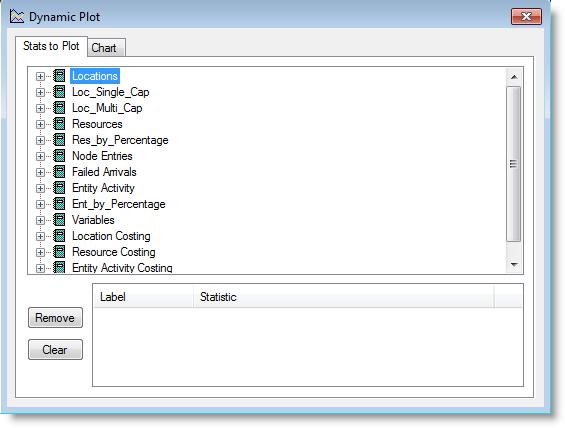
The tree view represents a hierarchical list of all plottable items in the model. Expanding and collapsing of tree items works in a manner consistent with standard Windows tree controls, including, but not necessarily limited to, double-clicking on a parent item, clicking on plus or minus graphic next to a parent item, and using the plus and minus keys on the number pad of most keyboards. When a subtree is fully expanded, individual plottable items are shown, as below:
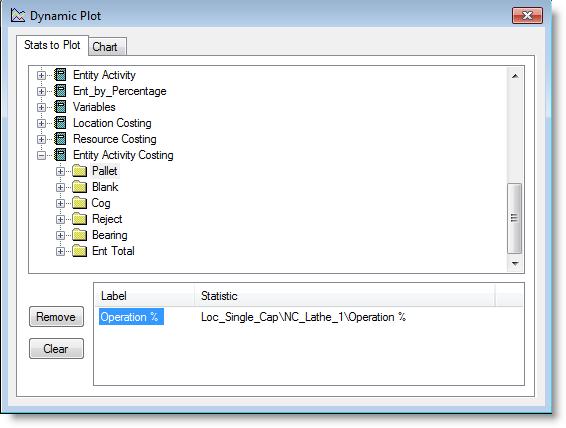
Each plottable item displays a checkbox to its left. When checked, the item is added to the list of currently plotted items below the tree view and the chart view begins to plot the value of the item. When unchecked, the item is removed from the list of currently plotted items, and the item is removed from the chart view. Items can also be added or removed from the chart view by double-clicking the item. If the item was not checked, this will check the box next to the item, add it to the current item list and the chart view, and switch immediately to the chart display. If the item was checked, this will uncheck the box next to the item, remove it from the current item list and the chart view, and switch immediately to the chart display.
The maximum number of statistics that can be plotted on a single chart is six. When six items are being charted and you attempt to add an additional item by either clicking the box next to the item or by double-clicking the item, nothing will happen and no changes to the chart will take place.
The item list below the tree view contains the items currently being graphed, arranged into two columns: a label and a statistic name. The label initially consists of only the text directly right of the item icon in the tree view, while the statistic name is composed of the names of the items ancestor nodes and the name of the item node itself. For example, for the "Avg Min per Entry" item under the Input location, the label would initially be set to "Avg Min per Entry" and the statistic name would be "Locations\Input\Avg Min per Entry."
Please note
When you click on the Label portion of the item in the list to select it and then click again, the label becomes editable, and you can type over or edit the existing text. This text becomes the new label for the item, and will now be displayed in the legend in the chart view.
The Remove button removes the selected item, if any, from the list, unchecks it in the tree view, and removes it from the chart view. Clicking the Clear button does this for every item in the statistic list.
Clicking the dividing lines between headings and dragging left or right resizes the columns in the statistic list.
The chart view is where graphical representations of changing model elements are displayed. It consists of a chart area and, optionally, any combination of the following: toolbar, legend, x- and y-axis scales, x- and y-axis labels, vertical and horizontal gridlines, and a chart title. An example of a chart view is shown below.
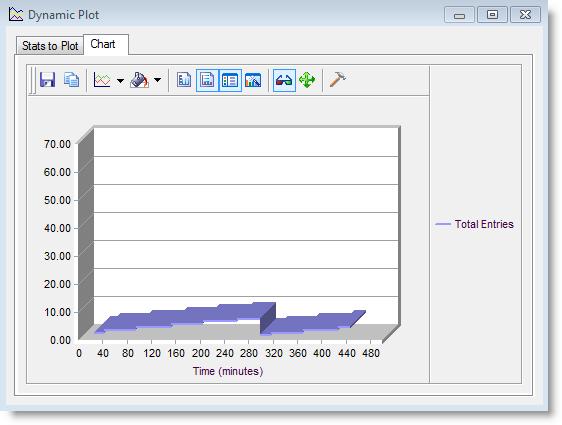
The x-axis indicates time elapsed from the start of the simulation, measured in clock precision units specified in the Simulation Options dialog. The y-axis measures values of the items being plotted. Both axes are re-scaled when necessary so that all data points fit within the chart area. When in the chart view, the maximize button in the title bar expands the chart itself to completely fill the area within the dialog, removing the "Stats to Plot" and "Chart" tabs and extra spacing. This may be helpful when you want to size the chart window as small as possible and still view the chart update. Clicking the minimize button will restore the chart to its normal state. The items being plotted are color-coded and the key is on the right-hand side of the window. Many of the chart options such as title and colors are customizable; simply click the right mouse button and select Properties… from the context sensitive menu options.
Information | Dynamic Plots | Configurations... is disabled if no saved configurations exist for the model and no dynamic plot windows are open. If enabled, selecting it opens a dialog box like the one below. The dialog box consists of a list box containing the names of any saved dynamic plot configurations for the model, an edit field, and Load, Rename, Delete, Save, and Exit button.
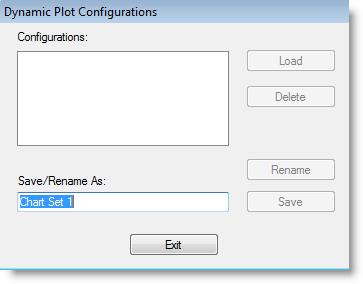
If you select a configuration from the list and click Load, the indicated saved configuration of chart(s) will be loaded, with all of the previous settings as far as selected data items, chart style, colors, fonts, visible elements, screen position and size, etc. If any of the previously selected data items no longer exist in the model, they will simply not be displayed. For example, if a statistic had been selected for a location that was later deleted from the model, it will no longer be selected.
Double-clicking on a configuration in the list has the same effect as selecting it and clicking the Load button.
The Delete button removes the selected configuration from the list and deletes the associated data from the model.
The Rename button changes the name of the currently selected configuration to the text in the Save/Rename As edit field.
Clicking the Save button saves all settings of any open dynamic plot windows, including selected data items, chart style, colors, fonts, visible elements, screen position and size to a configuration with the name specified in the edit field. If the name matches one of the configurations in the configuration list, this data will replace the previous data for that name.
The Save button does not actually save data into the model file. Rather, it creates or modifies a set of configuration data associated with a particular configuration name in memory and tags the model as being modified. If you exit the program, load a model, or execute the New command from the File menu you will be prompted to save the model. Using the Delete or Rename buttons in the configuration dialog also tags the model as modified.